由罗杰斯公司发布
高弹体材料解决方案
When designing for sealing and gasketing applications, two key elastomeric material properties that play a critical role are compression force deflection and compression set.
These properties are often found on technical data sheets (TDS) and provide important insights into a material’s cushioning, sealing, and vibration isolation capabilities. Understanding how these factors influence material performance can help ensure a reliable seal, especially in demanding environments.
In this blog, we’ll focus on compression force deflection and its impact on application design. Be sure to read until the end, where we provide a tutorial on a free tool designed to help you make more informed design decisions.
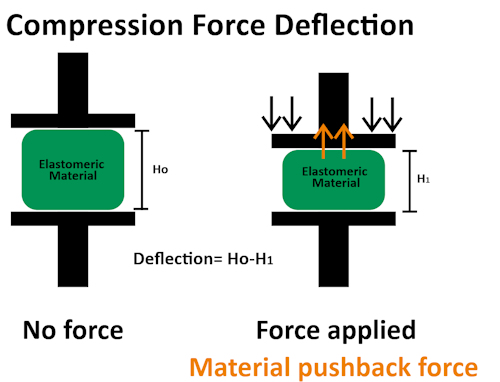
Compression force deflection (CFD), also known as compression deflection or compression force, is a test method that measures the force necessary to produce a percentage (%) deflection on a test specimen (in other words, how much force is required to compress a material by a certain percentage of its original height).
Let’s break this down in a simple way:
The image below depicts this concept.
Compression deflection tells us about a material’s ability to provide a pushback force when it's compressed. It’s a simple stress-strain relationship that reflects how much force the material pushes back on the system.
Compression deflection provides insights into how the material feels, its immediate resilience, and firmness. For most sealing and gasketing applications, an elastomeric material must be compressed to create a seal. Knowing how a material reacts under compression is key to ensuring it meets your design requirements.
For instance, does the material provide enough pushback force to create an effective seal? Or is the pushback force too high, potentially causing the enclosure to warp?
This is especially important for mission-critical applications like automotive sealing in electric vehicles (EVs), where the enclosure must protect batteries from water and external elements.
In EV battery sealing applications, the bottom enclosure must protect the batteries from water ingress and outside elements. The correct compression amount and pushback force are important to prevent leakage and maintain high performance under fluctuating conditions such as temperature and mechanical stress.
For most foam and sponge materials, the ASTM D1056 Compression Deflection test is followed. Typically, compression deflection is measured by compressing the specimen by 25% for a foam or sponge material. This is the amount reported on foam and sponge material technical data sheets, making it easy to compare different materials.
We are often asked, "What is an 'acceptable' compression deflection?" It depends on the application, but here are some key considerations:
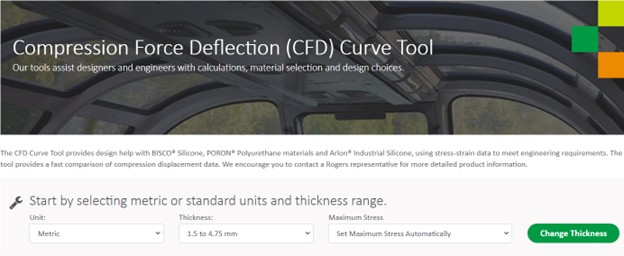
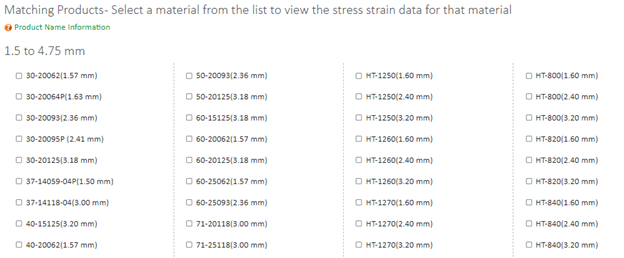
Rogers offers a Compression Force Deflection Tool to help you narrow down the best material fit from the BISCO® silicone, PORON® polyurethane, and ARLON® Industrial Silicone product portfolios. The Tool uses extensive stress-strain data across deflections from 0% to 80%, allowing for better material selection.
How to Use the CFD Tool:
When you first open the tool, you’ll see the following screen:
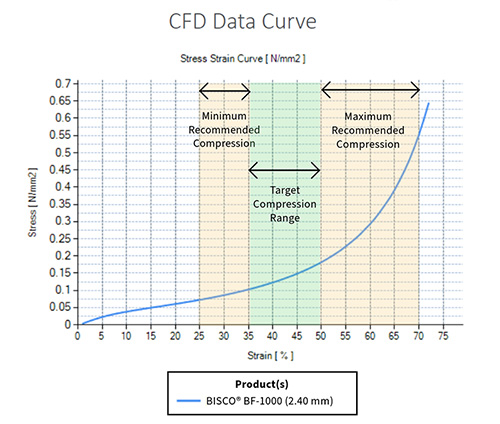
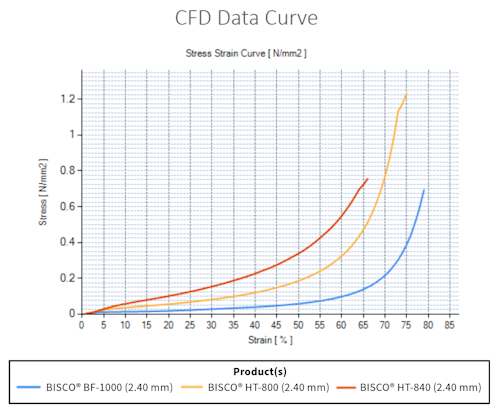
A compression deflection curve shows the relationship between the force applied and the material’s deflection. As you can see from the curves above, the relationship between the deflection and the resulting force of the foam is not linear. A foam or sponge material is less prone to compression at first since you are compressing the air spaces in the cells. But, as more force is applied, there is a point where the curve will start to increase rapidly. This is due to the material cells collapsing and being compressed. At this point, the material behaves more like a solid product. (read more about the characteristics of foams, sponges, and solids).
The further to the right a material’s curve lies, the softer it is.
In the example above, we can see that BISCO® BF-1000 is the softest, BISCO® HT-800 is medium firmness, and BISCO® HT-840 is the firmest (all the same thickness).
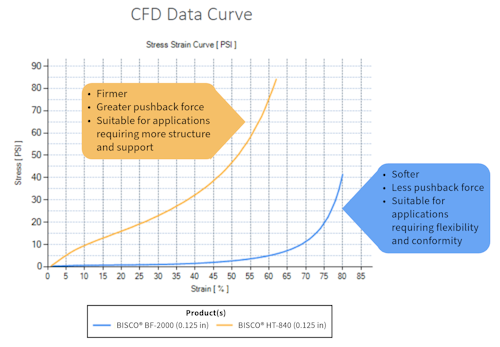
Materials with higher compression deflection values will be firmer and provide greater pushback force, making them suitable for applications requiring more structure and support. On the other hand, materials with lower compression force values are softer and more conformable, making them ideal for applications requiring flexibility and conformity to irregular surfaces, which helps absorb the thickness tolerances of mating materials.
Shore OO Hardness measures only a single, localized point on the surface of the foam, which doesn’t accurately represent the overall firmness of the entire material. It primarily gauges how the surface of a material dents, including x-y extension as well as vertical (z-axis) compression. This makes it more suitable for assessing the strength of the surface rather than full material performance.
In contrast, compression deflection measures the average firmness across a larger area of the material sample. This provides a more comprehensive understanding of how the material will perform under real-world conditions. By using compression deflection, designers can make more accurate decisions about material suitability based on its ability to withstand compression, ensuring reliable performance in a specific application.
Compression force deflection measures the force required to compress an elastomeric material over a specified distance (or in other words, how much force the foam exerts back (pushback force), giving insight into its cushioning, sealing, and vibration isolation capabilities.
Start optimizing your designs today for better sealing and performance by using the Rogers Compression Force Deflection Tool to quickly compare materials and identify the right fit for your application.
Contact a Rogers Sales Engineer for more information.
相关产品:
PORON Industrial Polyurethanes, BISCO Silicones, Arlon Silicones
发布于 2024 年 11 月 12 日